In June 2019 we (the urql team) decided to set an adventurous goal of creating fully-featured developer tools for our GraphQL client.
10+ months, 10+ contributors, and 100+ pull requests later, we're proud to announce our first major release! Read below for the journey on how we got there or skip to the announcement.
📦 Setting up an extension
One of the biggest hurdles we encountered when creating our first devtools extension was the initial boilerplate. For good reason, web pages can't talk directly to extensions or devtools panels without a myriad of communication layers.
We looked into existing implementations but found that, given their maturity, there was a lot more going on than just messaging. Because of this we decided to take our own approach by making use of an EventTarget in our background.js to route messages from our browser windows to their respective devtools panel.
We've found that this simpler approach, while it does have caveats, has worked great for our use cases.
- Having also received great feedback from others working on browser extensions in the community, keep your eyes peeled for a boilerplate project / tutorial from us in the near future!
💬 Sending messages from urql
Once messaging from the webpage to the devtools panel had been completed, it was time to put our money where our mouth is. urql has been created with extensibility in mind and we've been very vocal about this — so how did it do?
(Un)surprisingly well! Without modifications to the core urql client we were able to make an exchange which could:
- See all incoming messages and responses
- Inspect the state of the cache
- Trigger GraphQL requests (sent from the extension)
This more than sufficed for our early pre-releases, but as time went on we found that we wanted more.
Introducing the debug target
Implementation details are an important part of any developer tool and over time it became apparent that we needed to find a way to expose the internal events happening inside of exchanges. A few examples include network triggers and responses (fetchExchange), cache invalidation (cacheExchange), and any other events which would be useful for debugging purposes.
In order to accommodate for this, we've added additional debugging capabilities to urql as of v1.11.x. It works a little something like this:
- The urql client creates a debug source on creation
- A dispatchDebug function is passed to every exchange
- Exchanges can call this function to dispatch debugging events (at any time)
- Anyone with access to the client can listen to these events
- More details can be found in the new debugging section of the docs
For the devtools extension, this means that we can listen to debug messages coming from any exchanges and create a debugging experience for our users which is implementation agnostic - in other words, you could create a new exchange today and seamlessly have debugging info shown in the devtools extension just by calling dispatchDebug.
🛠 Building out the panel
At this point, we've now got messages coming from urql to the panel, so all we need to do now is create a webpage to present them... right? Well kind of...
Developer experience
In our first few months of working on the "frontend" of our extension, we found the developer experience to be rough, at best. Live reloading just wasn't an option, many changes would require us to reload the whole extension, and triggering/mocking debug events was a painful experience.
The biggest productivity booster, by far, was a few months in when we made the choice to develop using fixtures. This came with a whole host of benefits — from lowering the barrier to entry for new contributors, to faster updates thanks to the addition of hot reloading.
It also gave our team much more confidence in changes being made. We can quickly see the changes to fixtures while reviewing a PR and all our expected states are now modeled. To add to that latter point, fixtures allowed us to implement visual regression testing which would prove to flag unexpected visual and functional anomalies.
Design
Many of us working on this project have some kind of design experience in one form or another. As for design experience with browser extensions... not so much.
Data-heavy designs can be hard at the best of times; but add in the unique standards for browser panels such as smaller base font sizes, conservative use of spacing and color, and different interaction patterns - it doesn't take long to realize we're not in Kansas Bootstrap anymore.
While we're still learning, here are a few findings we've made on the way:
- Acknowledge existing design languages - Chrome and Firefox have some great devtools so use them as a starting point
- Aim for a highly static layout - theres going to be a lot of information on screen and having dynamic content such as panes appear and disappear can be more jarring than useful
- Keep your information hierarchy flat - there's just not enough space for a deeply nested hierarchy (i.e. elements such as h1, h2, h3, etc) so flatter is better
🚀 The end result
After all that work, we're happy to announce that urql Devtools v1 is out! Here's what it does to make your GraphQL development experience even better!
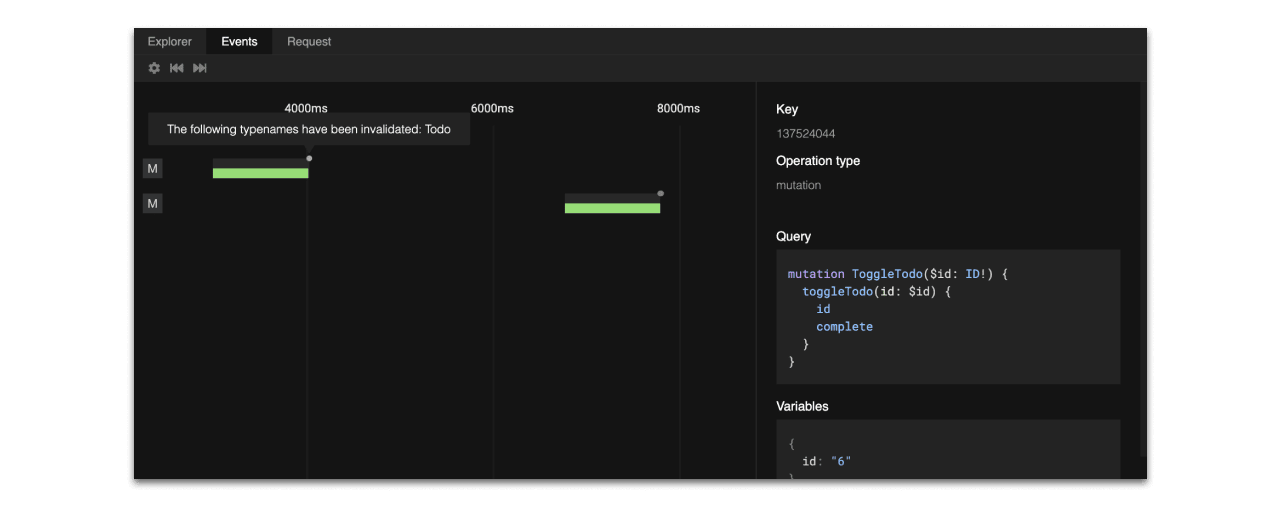
Event timeline
- Visualize all debugging events from your exchanges
- Track queries, mutations, and subscriptions that have been executed
- See network and cache updates, responses, and errors
- Locate which components are triggering GraphQL requests

The events panel in urql Devtools v1.0.0
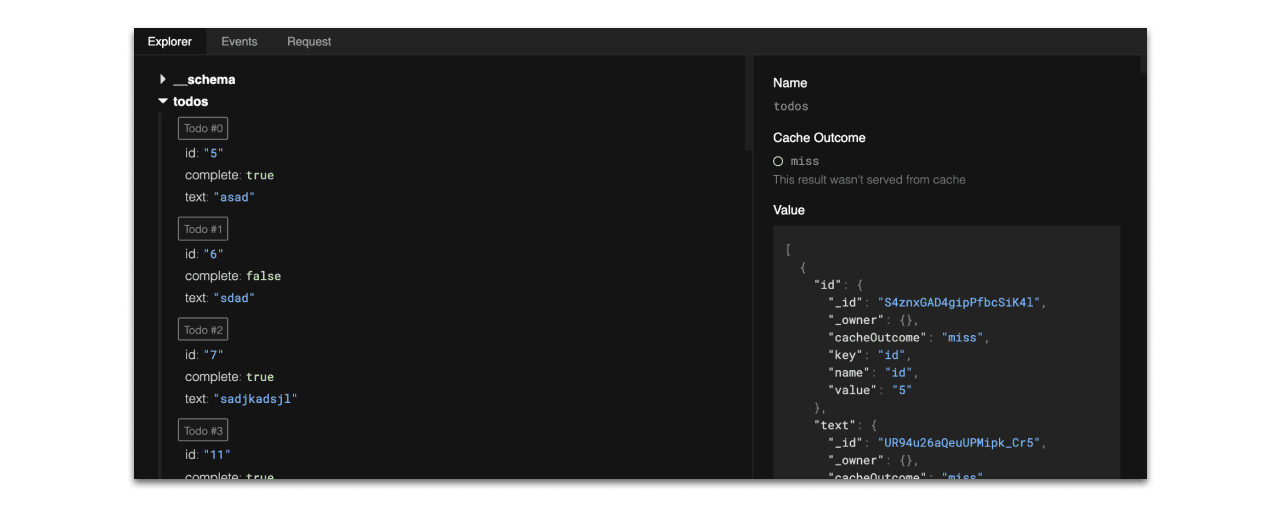
Cache Explorer
- Explore an interactive overview of your cache
- See which results are coming from the cache
- Identify updates to cached data

The explorer panel in urql Devtools v1.0.0
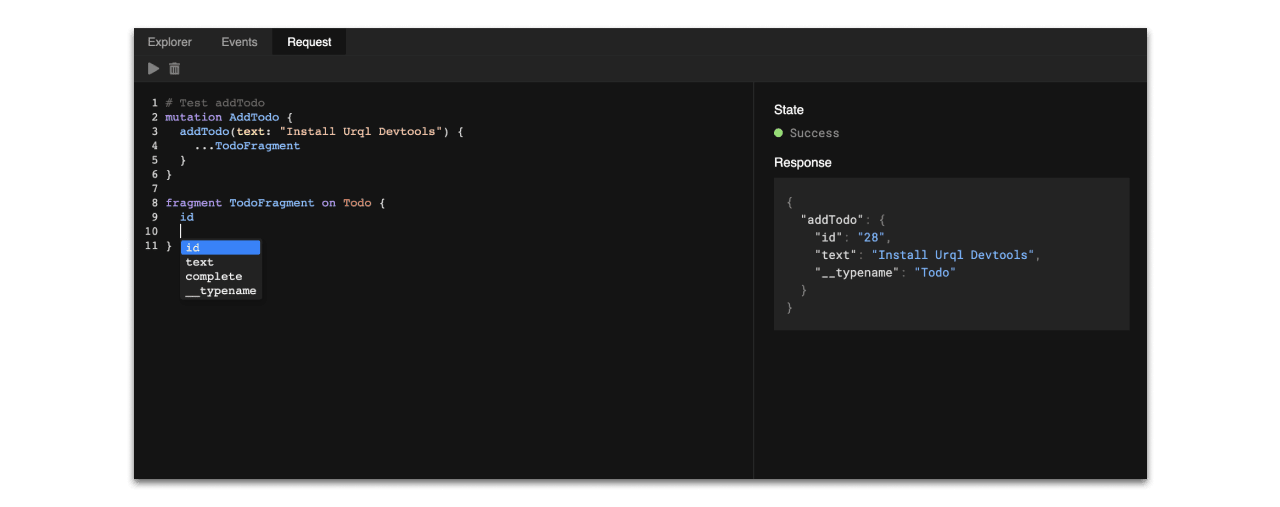
Request tool
- Trigger GraphQL requests directly via urql client
- Easily change the state of your app
- Explore your backend schema

The request panel in urql Devtools v1.0.0
🙏 We did it!
A special thanks to everyone in the community who helped make this happen!
Whether you contributed code, reported issues, created feature requests, or provided feedback — you've helped make the urql developer experience what it is! We look forward to seeing the ecosystem continue to blossom 🌻
To find out more or get involved, check out the resources below:


